

How do you know if your team is winning?
It’s a great question that unfortunately many leaders can’t answer objectively. The fix for this is creating a KPI scorecard.
Have you ever set ambitious goals for your team like increasing productivity by 20% or doubling the team engagement scores by the end of the year?
Using goals like this can be good for your business strategy but what happens when you’re near the end of the year and you’re nowhere near the goals you set?
Goal setting for your team boils down to an art and a science. First you must select the goals that you think align with strongly with your business (the science). Then, you need to find ways to make those goals attainable, reasonable, and motivating (the art).
Even more importantly, you need to be able to make those goals visual where progress (or lack of) can be shown. One way to do this is through use of KPI’s.
In this post, I’ll cover the following topics:
- What is a KPI?
- What are KPI Scorecards?
- KPI Scorecard Benefits
- How To Create KPI Scorecards in 8 easy steps
- Common KPI Scorecard mistakes
- Final Thoughts
What is a KPI?
This acronym stands for Key Performance Indicators. Qlik defines a KPI as a “quantifiable measure of performance over time for a specific objective. From finance and HR to marketing and sales, key performance indicators help every area of the business move forward at the strategic level.” I’ll give some examples of KPIs further down in the post.
What are KPI Scorecards
KPI scorecards visually show the goals, targets, and progress made over time in a clear and easy way to read. It helps people within an organization know if they are on or off track and give insights to make better decisions.
KPI scorecards can be used by any level of employee in the organization as well, from executives to front-line team members.
These scorecards have helped me and members on my team know where we should focus our efforts for improvement and where we should maintain progress. They have also let us know when we should set more assertive targets if we are consistently meeting our goals.
It’s always good to set new targets that will challenge a team!
See the KPI scorecard examples below to give you a better idea of what they can look like.
Benefits of KPI Scorecards
Bringing visibility to goals and progress with KPI scorecards makes it very easy and quick to understand whether your team is winning or not. This can help make course corrections and adjustments in real time as opposed to the end of the year crunch when you’re falling behind on your goals.
Here are some additional benefits:
- They help align your team’s goals to the organization’s strategy
- (Not so fun) fact: according to BSC Designer, 95% of the workforce does not understand its organization’s strategy!
- It helps identify where improvement and effort need to be focused
- It shows performance in real time
- It improves data driven decision-making
- It makes it easier to communicate performance to stakeholders and leadership
How To Create KPI Scorecards in 8 Simple Steps
1. Understand the goals your organization is trying to accomplish for the year
Are they focused on output, reducing costs, efficiency, customer experience, maybe all 4?
2. Identify what products or services your team is responsible for creating
For example, analysts typically produce reports, software engineers create online products, consultants provide business and consultative services, etc.
3. Create metrics for your team’s products or services that fit into the categories of quality, cost, delivery, safety, and engagement
Leveraging these metrics will help you create a balanced scorecard or BSC for your team. Balanced scorecards ensure you are keeping track of the metrics that measure your customer experience, cost, business processes, and the learning & growth of your team.
It’s balanced according to what should be the most important to running your business.
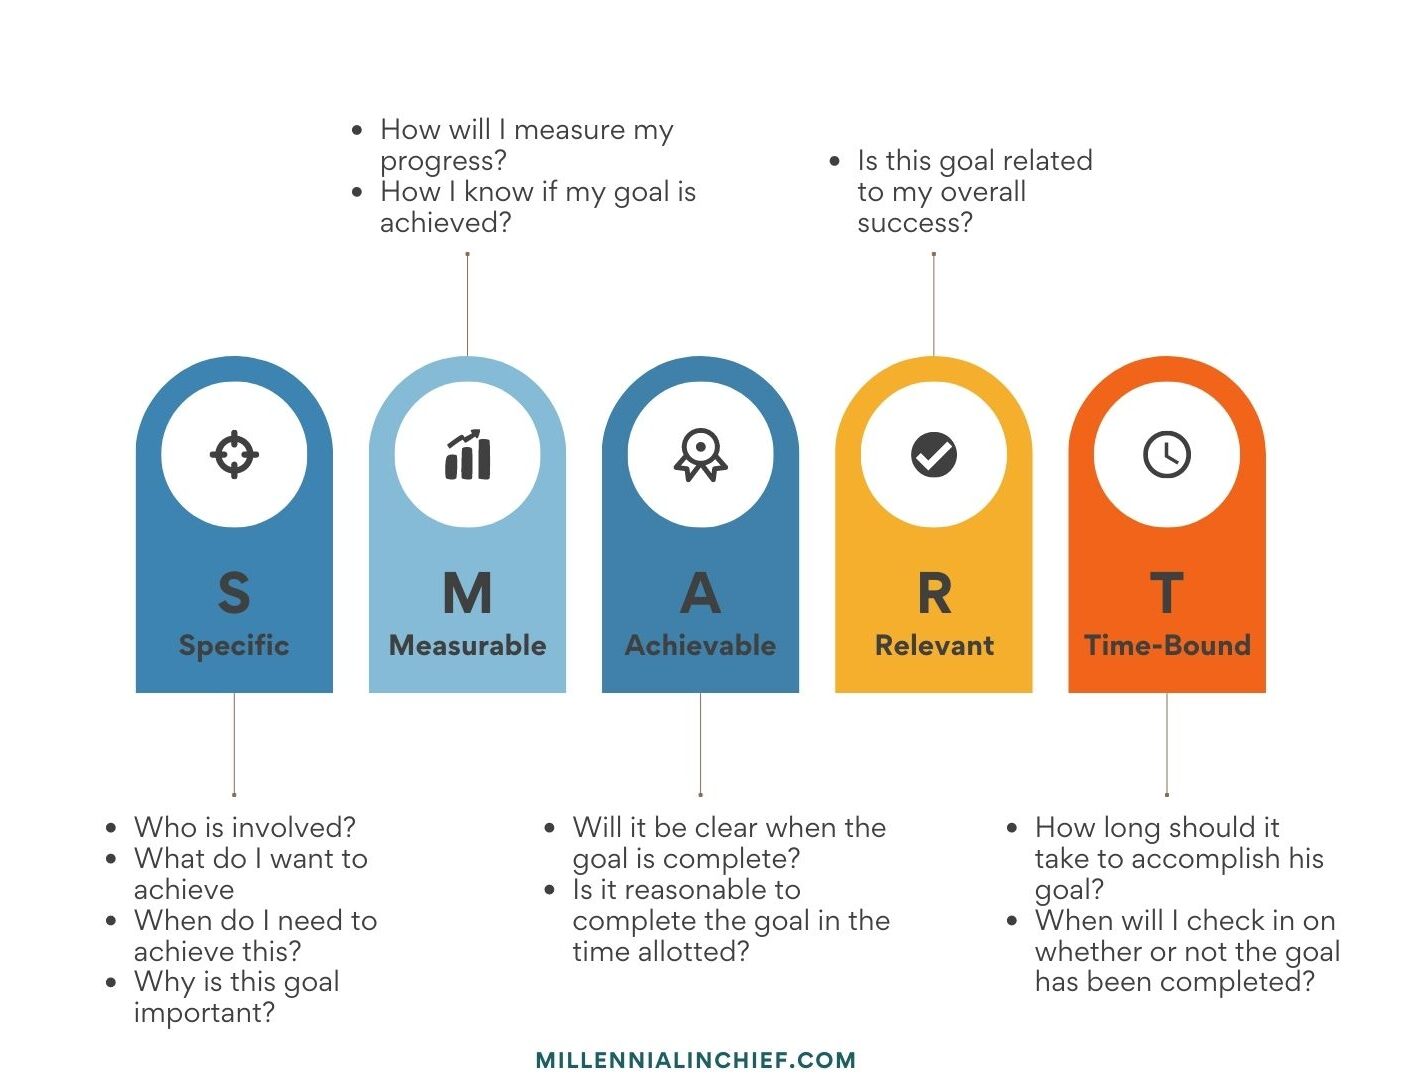
4. Create SMART goals for the key performance indicators (KPIs)
See the visual below that goes into more detail on what SMART goals are.
Here are some examples of KPI’s written in a SMART format:
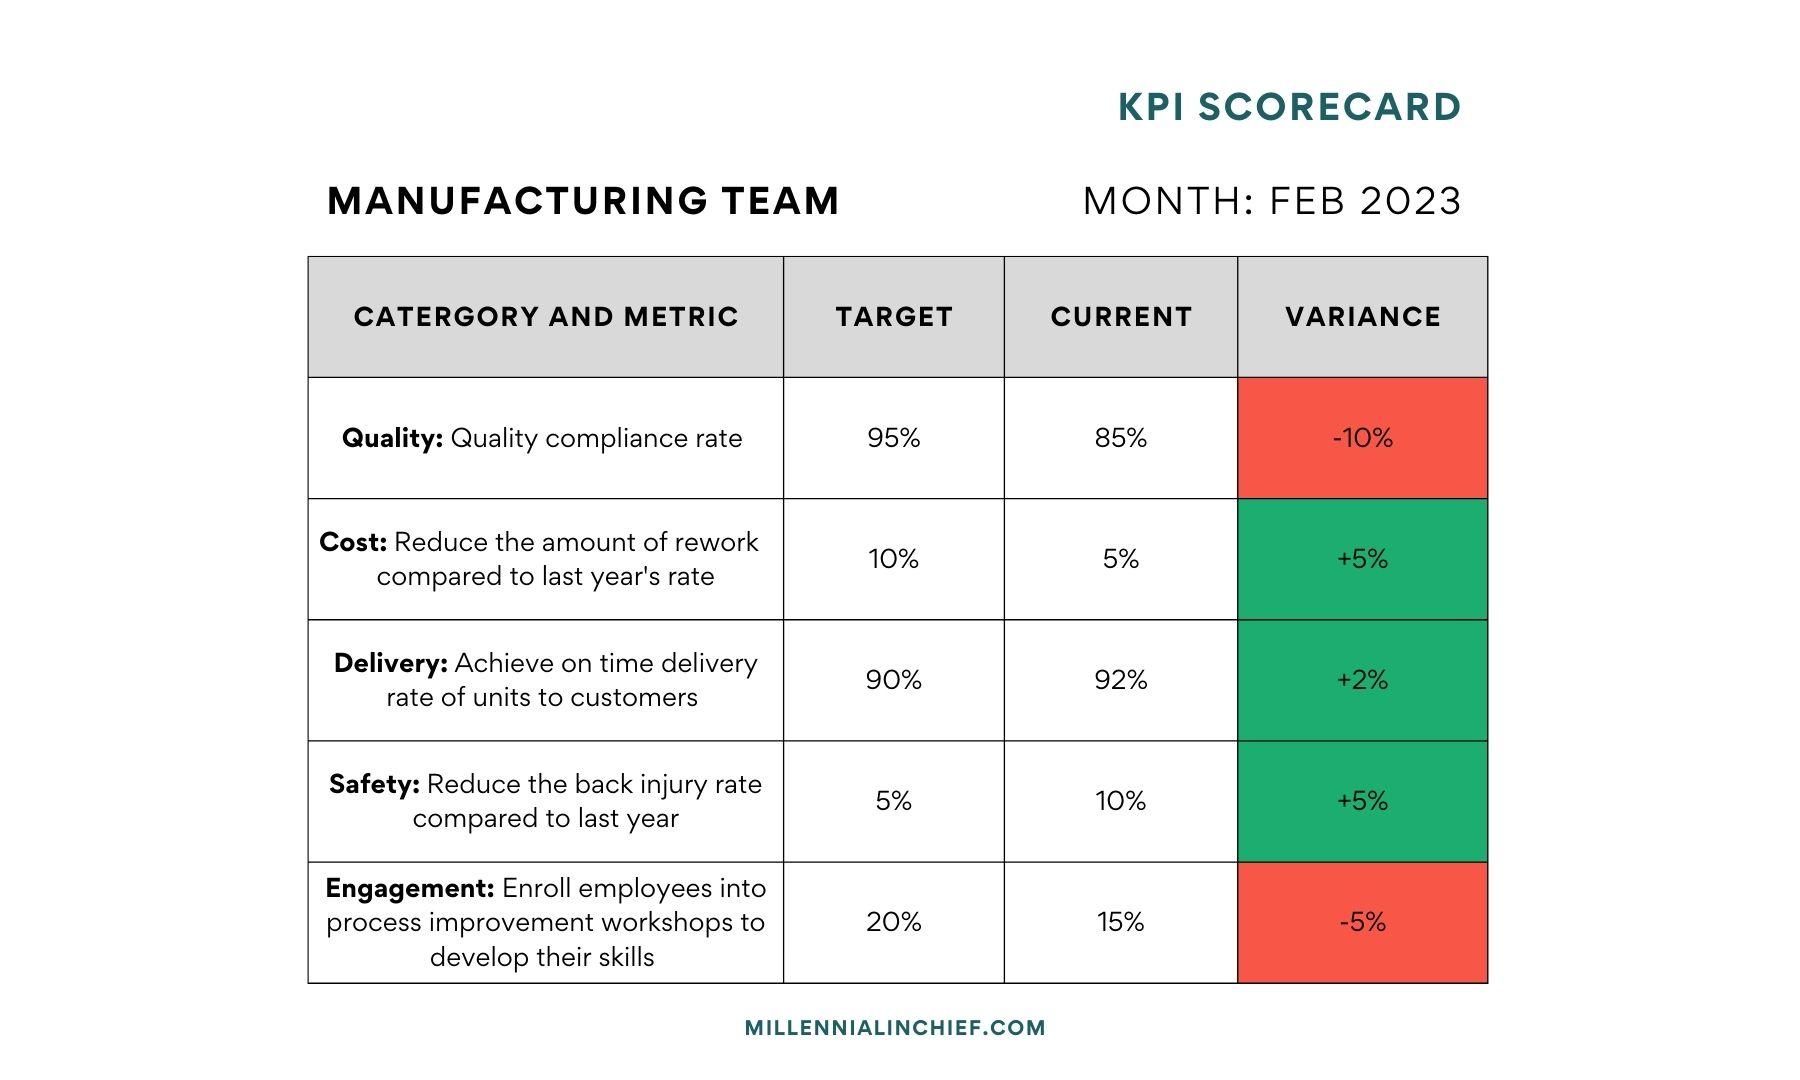
- Manufacturing Team (All targets to be met by the end of the calendar year)
- Quality: Achieve a 95% quality compliance rate for yearly units produced
- Cost: Reduce the amount of production rework by 50% compared to last year
- Delivery: Achieve a 90% on time delivery rate of units to customers
- Safety: Reduce the back injury rate by 50% compared to last year
- Engagement: Enroll 20% of employees into process improvement workshops to develop their skills
- Manufacturing Team (All targets to be met by the end of the calendar year)
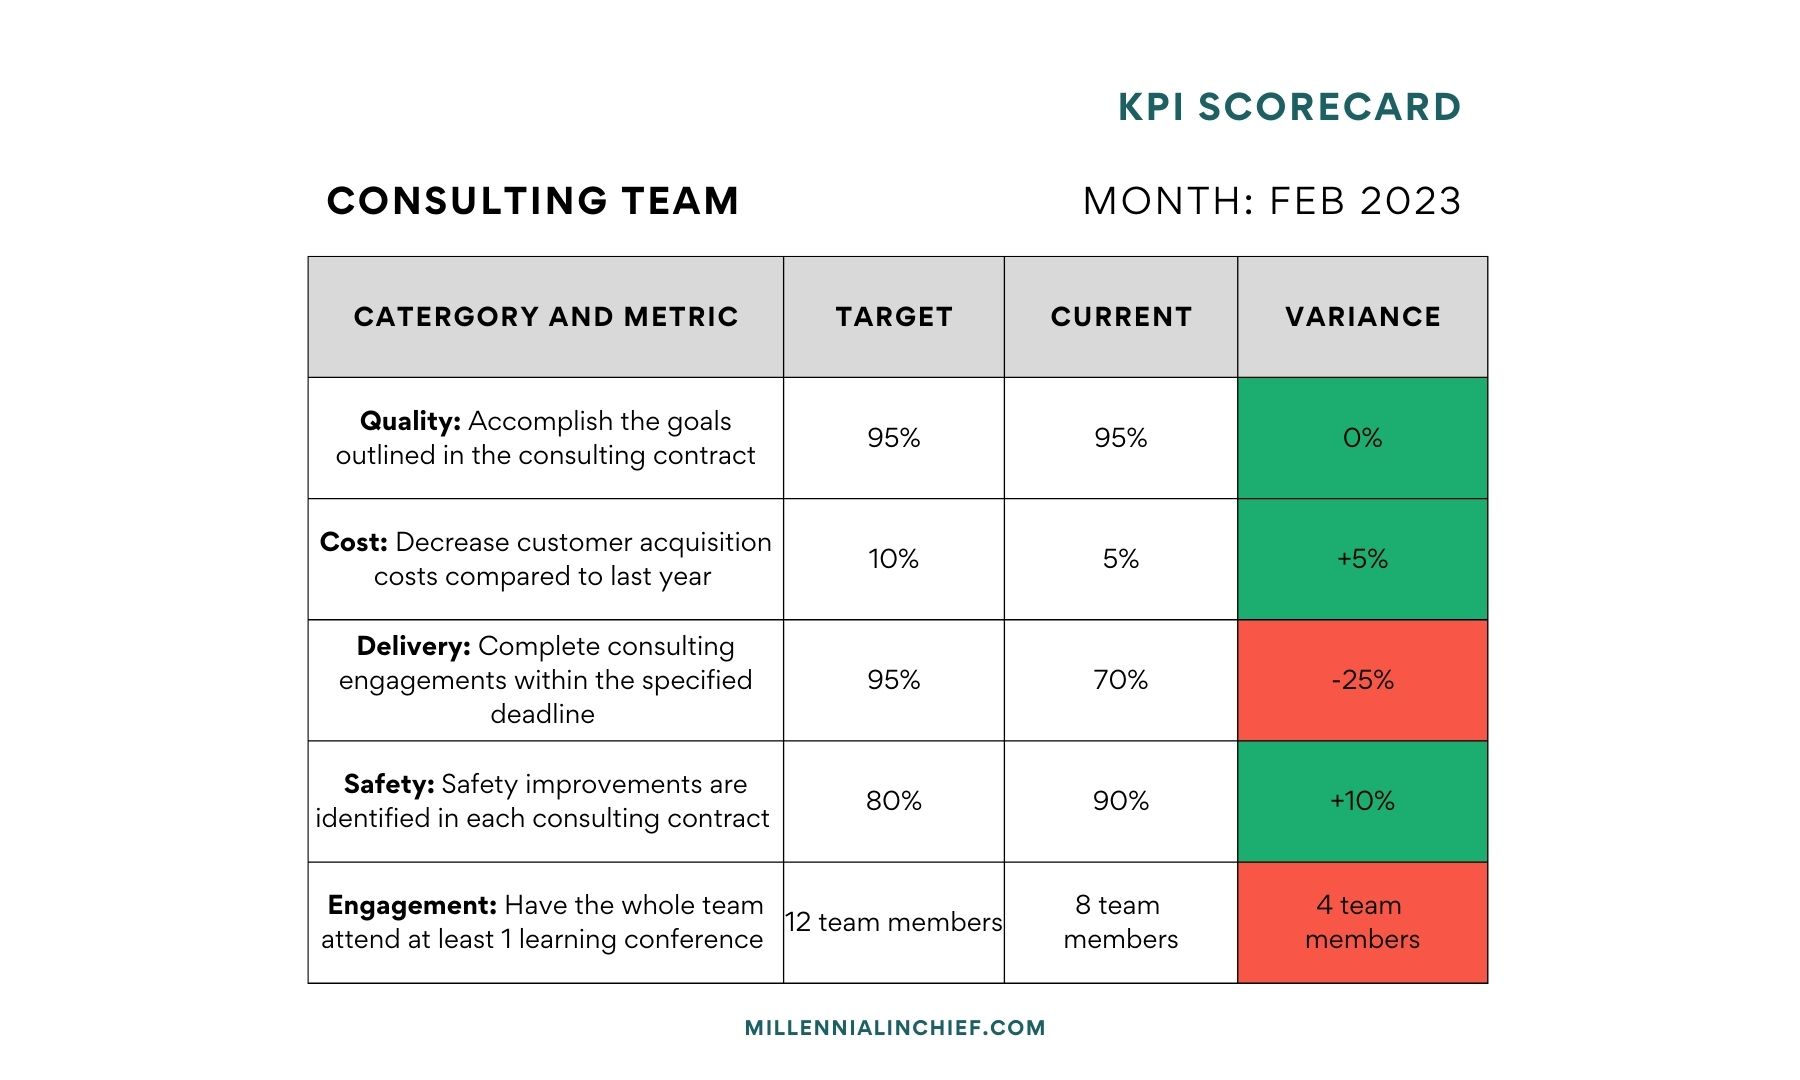
- Consulting Team (All targets to be met by the end of the calendar year)
- Quality: Achieve 95% of the goals outlined in the consulting contract
- Cost: Decrease the cost to acquire a customer by 10% compared to last year
- Delivery: Complete 95% of consulting contracts within thespecified timeline
- Safety: Identify and recommend 1 safety improvement for each consulting contract
- Engagement: 100% of consulting team members should attend at least 1 learning conference in the calendar year
- Consulting Team (All targets to be met by the end of the calendar year)
5. Identify the current state for each of the metrics
If you are setting SMART goals like in the examples above, you should know what the current state is in relation to those goals. For example, using the consulting engagement example goal above, if the goal is for 90% of consulting contracts to have a Net Promoter Score of 50 or greater, where is at for the current month?
If 100% of the client contracts received a net promoter score of 50 or above, your team is on track for the month. If 50% of the client contracts received a net promoter score above 50, then your team is off track and you’ll need to create a plan with the team to problem-solve
See the video below to learn more about Net Promoter Scores – a great way to measure your customer’s satisfaction!
6. Decide what program you want to use to create your scorecard
There are a variety of programs you can use to create your KPI scorecards. I recommend using excel because it is the easiest to input data, keep it up to date, and illustrate the data on run charts.
Run charts are a great way to track month over month progress to see if you are at target or not, and if you’re trending in the right direction. See the video below to learn how to create run charts
7. Place the KPI scorecard in a place that is visual for the whole team and review it with them at least monthly
This will ensure the whole team knows how they are doing for the month and if any process adjustments need to be made. Tip: it’s a lot easier to make improvement and adjustments in the current month as opposed to the end of the year.
8. Celebrate when the team is on target and problem solve when metrics are off track.
Keep the momentum going by celebrating and acknowledging when the team is meeting their goals. Ask what is going well and create a dialogue for your team to share their learnings.
If improvements need to be made, I highly suggest checking out some of my other posts on the initiating a problem-solving process – 5 whys, 80/20, reducing waste in a process to get the goals back on track
Common KPI Scorecard mistakes
There are a few common mistakes I have seen leaders make when trying to build KPI Scorecards. The most common are not making them visual, not including your team members in the problem-solving, not reviewing the metrics at least monthly, and trying to create metrics for everything. I’ll outline each one of these mistakes in more detail below:
Mistake #1 – Not making the scorecard visual
- If the scorecard for the team is stored in a private file, your team cannot know if they are hitting expectations or not. I’ve observed many leaders who have intentionally not shown teams their KPI scorecards for fear of making it awkward or feeling like it is a micro-managing tool.
- I strongly recommend putting the KPI scorecards in a place that is visual for the whole team like a shared team site or on a whiteboard. Visibility will create awareness and awareness will generate more engaged teams. Engaged teams are more willing to problem-solve.
Mistake #2 – Not including your team to problem solve when goals are below target
- Your team are the ones in the weeds doing the work. If goals aren’t being met, chances are your team knows why. By involving them in the problem-solving process you hear their insight and knowledge at the level where the work is being done.
- For example, using the consulting KPI scorecard above with the goal of “decreasing the cost to acquire a customer by 10% compared to last year”, your team probably knows what goes into the costs of acquiring customers.
- Ask them where they think the biggest expenditures are and where there is waste in the process. They’ll have answers and be more engaged and empowered in helping to solve them problem.
Mistake #3 – Not reviewing the metrics on a regular basis
- Creating KPI scorecards is not a set it and forget it strategy. You must constantly be monitoring the metrics for any trends, opportunities, and issues especially if you’re not meeting targets.
- I highly recommend reviewing the metrics on at least a monthly basis. By placing the KPI scorecard in a visual area and reviewing it at least monthly with them team, you’ll create a great standard for ensuring that you know how the business is performing.
Mistake #4 – Trying to create a whole bunch of metrics
- When I have consulted with different leaders on creating KPI scorecards they most often have wanted to measure too many things. Measuring too many things will get overwhelming for you and your team. It will take a lot of energy to consistently review, update, and problem-solve when there are too many metrics to keep track of.
- Instead, I recommend reviewing step 1 of how to create KPI scorecards again. Identify the things that your organization cares most about. Then aim to create 1-2 metrics within each category of quality, cost, delivery, safety, and engagement. This will keep the exercise manageable and sustainable.
Final Thoughts
As outlined above, creating KPI scorecards has numerous benefits to boosting your team’s business performance. There is a great saying when it comes to metrics and it is, “what gets measured, gets done”.
I highly suggest getting started with the 8 simple steps to create your own KPI scorecard. Know that it will take some iteration and refinement initially, but it will greatly help you to prioritize where you and your team should be focusing their time, eventually helping your team win.